I think we have likely all been in a journal club, or discussion, or just reading a paper where we look at a figure and think “Oh wow that’s not the best looking figure they could have made here”. Often times this is because the authors are trying to represent many dimensions simultaneously — the merits of which we can discuss another day. Sometimes however, the styling of the figure is just not as nice as it could be.
I would venture that one reason for this, at least in the context of figures made with matplotlib, is the relatively verbose nature of matplotlib’s styling system. If you want to make a truly wonderful figure, not just in terms of the data show, but also in terms of how it shows the data, you have to spend 10s of lines configuring the style.
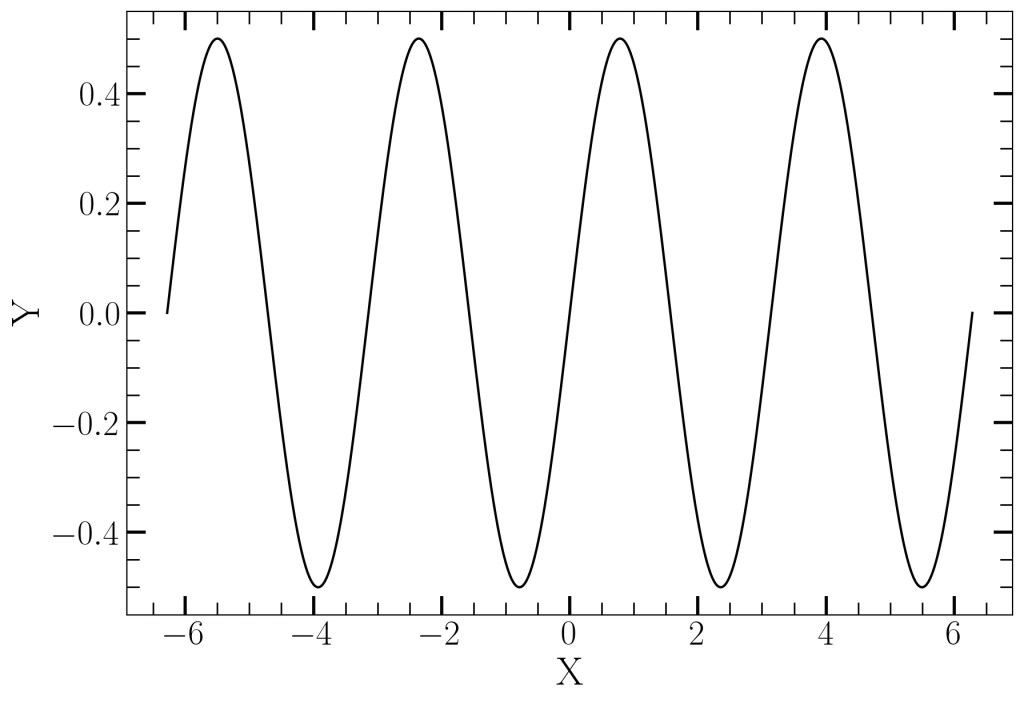
As an example here is my preferred configuration most of the time (this acts as a great starting point, though I often have to make minor tweaks on a per figure basis)
import matplotlib.pyplot as plt
import matplotlib as mpl

# Render all text with latex using Computer Modern
plt.rc('text', usetex=True)
plt.rc('font', family='Serif')


mpl.rcParams['figure.figsize'] = [10, 7]
mpl.rcParams['font.size'] = 25

mpl.rcParams['savefig.dpi'] = 150
mpl.rcParams['xtick.minor.visible'] = True
mpl.rcParams['ytick.minor.visible'] = True
mpl.rcParams['xtick.direction'] = 'in'
mpl.rcParams['ytick.direction'] = 'in'

mpl.rcParams['xtick.top'] = True
mpl.rcParams['ytick.right'] = True

mpl.rcParams['xtick.major.size'] = 12
mpl.rcParams['xtick.minor.size'] = 8

mpl.rcParams['ytick.major.size'] = 12
mpl.rcParams['ytick.minor.size'] = 8

mpl.rcParams['xtick.labelsize'] = 22
mpl.rcParams['ytick.labelsize'] = 22
As a brief summery of what these settings do: first, they make the fonts in the figure look consistent with the fonts in your paper (assuming it is being typeset with TeX or some TeX derivative), second, they add in major and minor ticks on all sides of an axes (top, bottom, left, and right), finally, they set the lengths and fonts to values which I have found quite readable when the figure is included in a paper. An example of a figure generated with these settings is given below
Now, you may disagree with my style choices, the point is not that the style I present is the best; rather, it is that you should have some explicit style choices. Whatever your style choices are you would have to copy your configuration into the python environment you use every time. This can be tedious to implement every time you want to make a figure.
I tend to make all my figures in Jupyter lab (its one of the limited things I think Jupyter Lab is very useful for) and if you do the same then there is a very simple way which you can automatically load this style for every notebook.
On *Nix systems with iPython (the python kernel Jupyter uses) a file called 00-first.py is run at startup of every iPython kernel. Anything you put in there will be run before you type any code. Therefore, if you put your matplotlib configuration in there every notebook you use will inherit that style. I’ve kept my default style stored in 00-first.py for 5 years and have never looked back.
On most systems The 00-first.py file is, by default, located at $HOME/.ipython/startup/00-first.py. It may not exist yet, but make a file there and put in your config and iPython/Jupyter should inherit from it.
